Building Real-Time Proteome Simulations with Mass Spectrometry, Live-Seq, Raman Imaging, and Machine Learning
Table of Figures
List of Abbreviations
| Abbreviation | Meaning |
|---|---|
| MS | Mass Spectrometry |
| HPLC / LC | High-Performance / Liquid Chromatography |
| HCD | High-energy Collisional Dissociation |
| ESI | Electrospray Ionisation |
| TIMS | Trapped-Ion Mobility Spectrometry |
| FAIMS | Field Asymmetric Ion Mobility Spectrometry |
| CCS | Collisional Cross Section |
| TOF | Time-of-Flight |
| MS1 / MS2 | First / Second stage MS run |
| SCoPE2 | Single-Cell Proteomics by Mass Spectrometry 2 |
| TMT-pro | Tandem-Mass-Tag (18-plex) |
| AQUA | Absolute QUAntification heavy peptide standard |
| MARQUIS | Multiplex Absolute Re-QUantification Using Internal Standards |
| iBAQ | Intensity-Based Absolute Quantification |
| Bayesian iBAQ | iBAQ weighted with Bayesian priors |
| RNA-velocity | Spliced/unspliced RNA to predict future states |
| Slingshot | Trajectory inference (pseudotime) |
| t-SNE | t-distributed Stochastic Neighbour Embedding |
| d::pPop | DL model for peptide detectability |
| DeepMass | DL model for ionisation efficiency |
| PASEF | Parallel Accumulation–Serial Fragmentation |
| Live-Seq | Force-microscopy cytoplasmic sampling for scRNA-seq |
| DropMap | Droplet assay for secreted proteins |
| MEFISTO | Method for Function Integration of Spatial & Temporal Omics |
| ODE | Ordinary Differential Equation |
| CRL | Causal Representation Learning |
| PTM | Post-Translational Modification |
| GSEA | Gene-Set Enrichment Analysis |
Summary
Goal: To develop in-silico single-cell proteomic simulations to facilitate virtual drug testing and hypothesis generation.
Problem: No technology currently measures thousands of protein copy numbers in the same cell at multiple time-points, yet such data are needed to train a real-time simulator.
Solution: A modified SCoPE2 single-cell mass-spectrometry protocol paired with Live-Seq and Raman imaging. Machine learning is split into (1) a translational model converting Raman/Live-Seq to proteome snapshots, and (2) a dynamics model predicting proteome evolution through time.
Real-Time Proteomic Simulation
With a database comprising thousands of quantitative protein measurements at the single-cell level, across multiple time points, it may be possible to use machine learning to predict how a cell’s proteome evolves over time (Fig. 1). If so, one could construct a simulation where you load an initial proteome, change the level of a target protein, and watch how that adjustment affects cellular function through time. The simulation could also be run in reverse: start from a desired state and infer which proteins would need to be targeted to reach it.
Proteomic data alone is unlikely to be sufficient to simulate proteome dynamics, because protein changes are influenced by other “omic” domains (e.g., lipidome, transcriptome, spatial omics). The amount and type of information required for a practically useful simulation is unknown and would be discovered empirically; however, most successful time-series cell models incorporate multiple modalities. A proteomic simulator would have broad applications in drug discovery, therapeutic development (e.g., optimizing stem cell and exosome treatments, vaccines), aging research, toxicology, and synthetic biology.
Developing such a model, given an adequate database, should be feasible with current machine-learning frameworks, which are well-suited to time-series prediction. At present, the largest technical hurdle is producing the necessary database. No protein-measurement technology currently provides thousands of quantitative protein measurements in the same single cell across multiple time points. The purpose of this technological application essay is to address a small aspect of the challenge of acquiring that proteomic database.

Brief Description of Mass Spectrometry for Proteomics
First, the sample is homogenised (dissociating any tissue into cells), the cells are lysed, and the proteins are digested into peptides. These peptides are then run through high- performance liquid chromatography (Fig. 2A), where they are separated based on their retention time within the column. The eluted peptides, still in liquid form, must be converted into gaseous ions, as their movement inside the mass spectrometer is controlled by electric fields. This ionisation is achieved via electrospray ionisation (ESI): a narrow channel of peptide solution is passed through a high-voltage tube tip, causing ionisation.
Following ionisation, peptides enter the mass spectrometer. Besides retention time (which produces a chromatogram, Fig. 3A), they can undergo another selection process based on ionic mobility, using either TIMS (Trapped Ion Mobility Spectrometry; Fig. 2D) or FAIMS (Field Asymmetric Ion Mobility Spectrometry; Fig. 2F). Both techniques allow peptide selection based on collisional cross-section (CCS). The peptides then pass through a quadrupole (Fig. 2B), which can filter by mass-to-charge ratio (m/z).
The workflow involves two run types: MS1 and MS2. In MS1, the quadrupole is in RF-only mode, allowing all peptides to pass. Their m/z values and relative intensities are measured in an Orbitrap (Fig. 2G) or a Time-of-Flight analyser (Fig. 2E), producing an MS1 spectrum (Fig. 3B). In MS2, peptides of specific m/z are selected by the quadrupole and fragmented in a collision cell (Fig. 2C), producing an MS2 spectrum (Fig. 3C) that represents fragment composition of a peptide.
Because each peptide produces a characteristic MS2 spectrum upon fragmentation, comparing spectra allows identification of peptides within each MS1 region. Protein inference methods such as SEQUEST (Fig. 3D) then reconstruct protein identities from peptide data. Basic proteomics with MS therefore enables accurate relative quantification across samples (e.g., Protein X is two-fold higher in Sample B compared with Sample A). Differential protein expression can then undergo analysis techniques like gene-set enrichment analysis (GSEA) to reveal affected biological pathways. In sum, mass spectrometry enables measurement of thousands of proteins with high accuracy and minimal input material, making it ideal for building the required database.


Using Mass Spectrometry to Generate the Database
For the required database, SCoPE2 is currently the most powerful mass spectrometry approach, enabling quantification of ~1,000 proteins across thousands of cells. The protocol for SCoPE2 is shown in Fig. 4. Low protein yields from single cells are addressed by using tandem mass tags (TMT) specific to each cell, pooling cell contents together, and analysing them simultaneously. To further enhance detection, many more carrier cells are pooled and run in parallel, enriching the peptide channels so that low-abundance peptides can be detected and assigned back to individual cells.
Although SCoPE2 produces large amounts of single-cell proteomic data, several limitations remain before it can generate the database required for real-time simulation. These include: ionisation bias, redundant proteins, and sample destruction. Below is a description of modifications to the SCoPE2 protocol that may help address these challenges.

Ionisation Bias
Most proteomic data produced from mass spectrometry is sample-to-sample relative. This means they do not measure absolute protein values, nor relative values within a single sample. While relative quantification is useful for many biological hypotheses, such as determining whether a condition changes a target protein or pathway, it is not sufficient for generating the absolute data required for real-time proteomic simulations.
The major hurdle to absolute quantification in mass spectrometry is ionisation bias, the tendency of different peptides to ionise at different rates. Without knowing each peptide’s ionisation bias, absolute quantities cannot be inferred from relative intensities.
Methods have been developed to mitigate this issue. One is AQUA (Absolute Quantification), which spikes samples with known quantities of tagged peptides, compensating for ionisation changes. However, AQUA becomes prohibitively expensive at single-cell scale: with ~1,000 proteins per run and peptides costing €200–300 each [1], a single run would cost ~€250,000. Moreover, thousands of AQUA peptides would swamp MS spectra, reducing both coverage and accuracy.
Label-free strategies offer alternatives. A calibrated chromatogram library can be built once with reference peptides and then applied to correct future runs. Examples include the Mann/PeLa deep library, SWAT Atlas, and MassIVE-KB. Another approach, the proteomic ruler, uses histones (which occupy a fixed mass per diploid genome) as a built-in calibrant, scaling all other proteins to copy numbers per cell. Finally, deep-learning models such as DeepMass predict peptide-specific response factors from sequence and charge, further correcting ionisation bias.
In practice, a hybrid strategy may be most effective: combining ~10–20 anchor AQUA peptides, a MARQUIS protein ladder, chromatogram libraries, and DeepMass modelling. Together, these methods can approximate AQUA’s accuracy at a fraction of the cost.
From a hardware perspective, an Orbitrap Eclipse / timsTOF PASEF hybrid would theoretically deliver both Orbitrap-level intensity accuracy and PASEF’s speed and 4-D fingerprinting. Although such a machine does not currently exist due to vendor IP separation (ThermoFisher vs. Bruker), similar functionality could be achieved with an Orbitrap Eclipse Astral or timsTOF Ultra.
Deep-learning tools like d::pPop can pre-select proteins with detectability scores >0.8 from FASTA sequences. Meanwhile, 16 heavy AQUA peptides spanning 6–180 kDa could be synthesised as calibration anchors. In this scheme, SCoPE2’s 18-plex TMT-pro channels would be distributed as follows: 1 carrier, 4 MARQUIS ladder channels, 1 global reference, and 12 single-cell channels. Four AQUA concentrations across TMT channels would generate the MARQUIS calibration. The proteomic ruler and global reference would normalise copy numbers across runs. DeepMass-based correction factors, integrated with Bayesian iBAQ priors, would then propagate peptide-specific adjustments.
Because the 16 AQUA peptides span the dynamic range, they act as calibration weights. Once the instrument’s ionisation response curve is fixed, every peptide inherits a corrected factor based on its DeepMass score. This combined strategy would maximise both coverage and accuracy of absolute protein quantification at the single-cell level.
Redundant Proteins
A second problem with mass spectrometry is in determining the quantity of redundant proteins. Bottom-up MS works with only short peptide fragments, and the protocol may not be able to distinguish between two proteins without additional information. For example, many histones share identical peptide sequences despite having distinct functions. Current protein inference methods cannot resolve this ambiguity within protein groups.
This limitation is specific to bottom-up proteomics, where proteins are digested into peptides before MS analysis. In contrast, top-down proteomics keeps proteins intact, allowing the mass spectrometer to capture information about their tertiary structure. This enables more accurate measurement of relative abundances for proteins with identical peptide sequences.
In practice, a hybrid approach may be useful: part of the sample material is processed for bottom-up proteomics, while a fraction of the carrier material (e.g. ~10%) is diverted for targeted top-down proteomics. This would provide the proportions of each protein within identified protein groups at the single-cell level.
Such a protocol could also help identify key post-translational modifications (PTMs). Combined with the coverage improvements described in the previous section, the addition of a top-down module could enable the modified SCoPE2 workflow to capture ~2,000 proteins per cell. Across diverse cell populations, the total matrix might extend to ~6,000 proteins.
Sample Destruction
A key requirement for building the database is longitudinal data, multiple measurements from the same cell over time. Unfortunately, SCoPE2 (and all other proteomic mass spectrometry protocols) are destructive: cells are lysed during sample preparation. This means proteomic MS cannot be used alone for generating the required database.
A potential workaround is to build a cross-sectional translation matrix between the proteome and a secondary omic domain that allows repeated measurements from live cells. This would enable longitudinal data to be converted into proteomic data, providing de facto longitudinal proteomic profiles. In practice, an initial MS run could be paired with secondary omic measurements taken just prior to lysis, allowing machine learning to map one modality onto the other. Candidate secondary domains include Live-seq, secretome microfluidics (DropMap), and hyperspectral Raman imaging (Fig. 5).
Live-seq samples cytoplasm from cells without killing them, enabling scRNA-seq with measurements of ~6,000–10,000 genes per sample. Currently, throughput is low: 4–5 samples/hour per operator (~30–40 samples/shift), with viability limited to 2–3 samples per cell. Future automation and improved cell survival could increase feasibility, but for now Live-seq alone is insufficient.
DropMap offers more continuous data, but is currently limited to just three fluorescence channels, making it inadequate as the sole secondary domain. Raman imaging, by contrast, generates hundreds of spectral features continuously, reflecting lipids, proteins, and metabolites. Although spectral features may not map directly to proteomes, recent studies have shown Raman can reconstruct paired scRNA-seq data, suggesting similar feasibility for proteomics. Throughput using line-scan Raman is ~2,000–2,500 cells/day, though Live-seq would remain the rate-limiting step if combined.
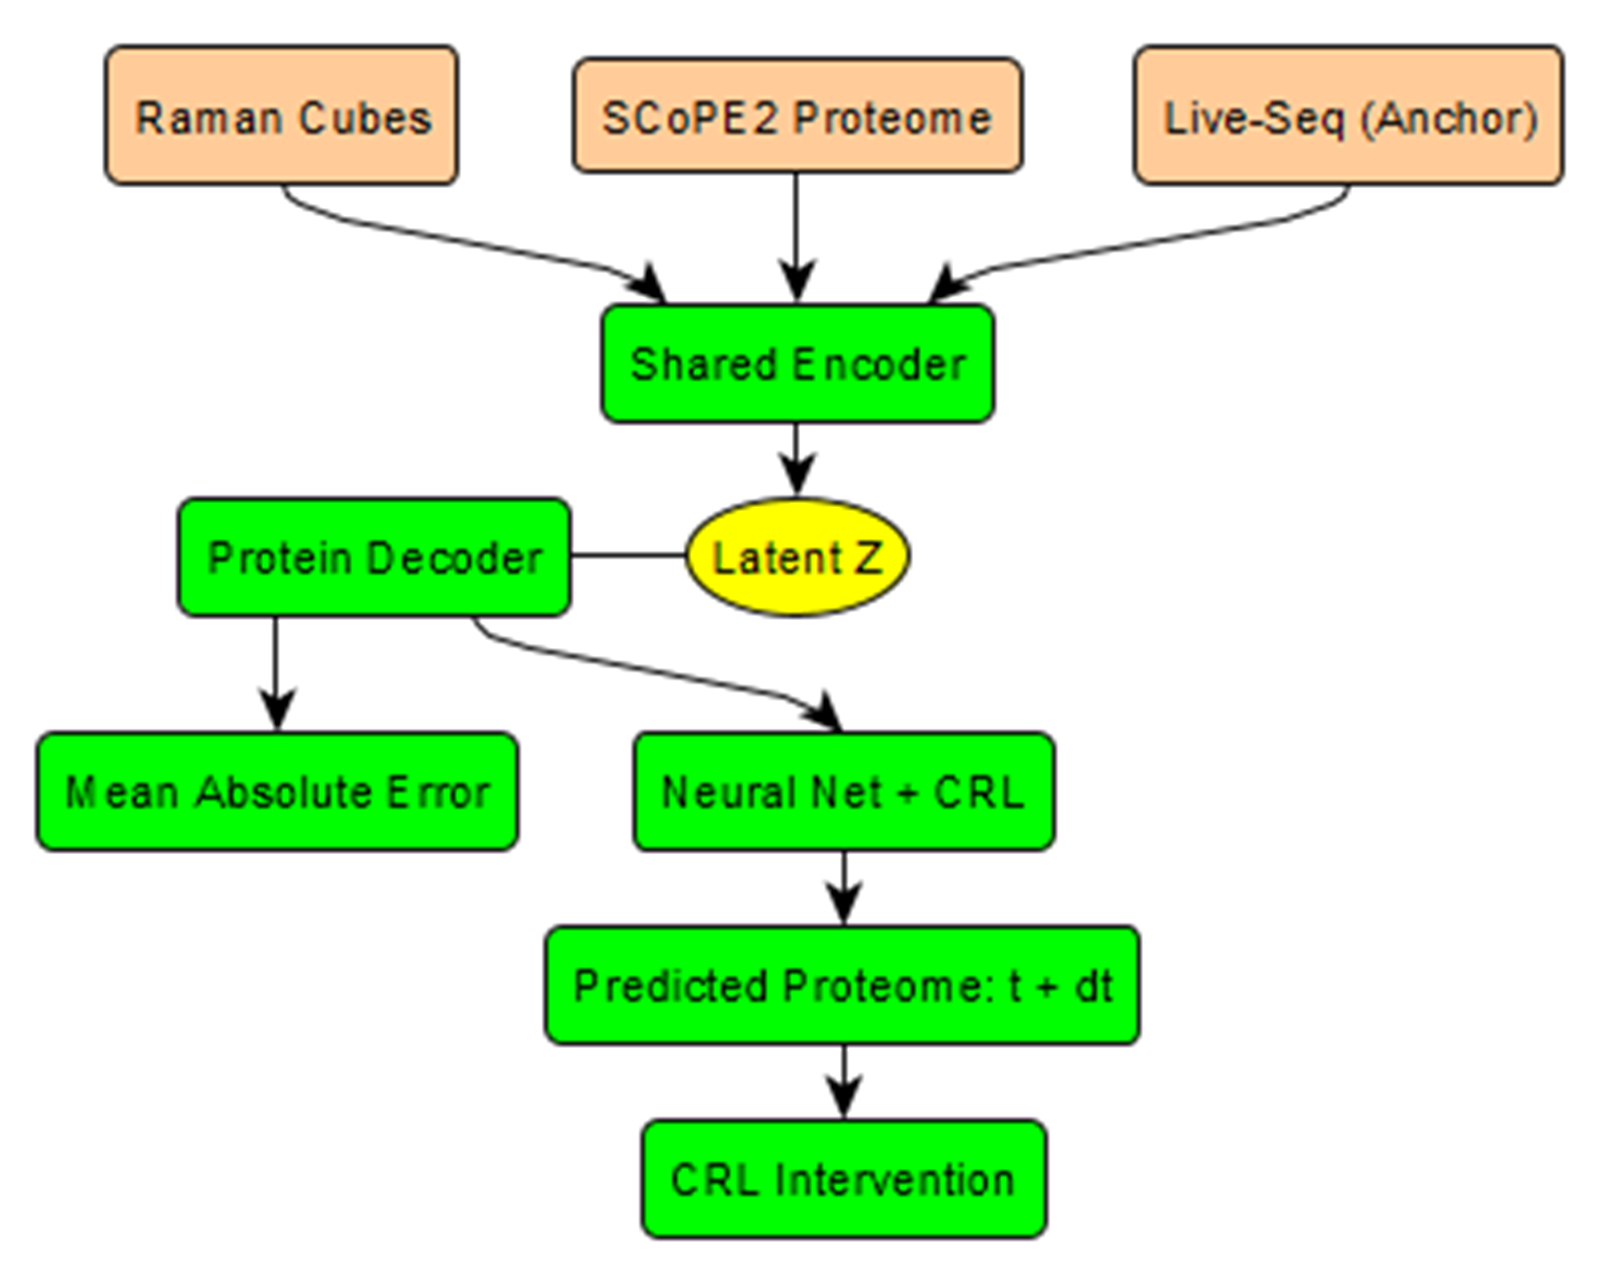
A hybrid strategy could therefore address sample destruction: continuous Raman imaging supplemented with Live-seq anchors at three timepoints, followed by terminal SCoPE2 mass spectrometry. This workflow would allow training of a translational model mapping Raman data (R) and Live-seq data (T) into a latent representation (Z), aligned with proteomic data (P). In practice, inter-anchor Raman-only data could be mapped R → Z → P, avoiding overfitting to optical artefacts. Multimodal frameworks such as MEFISTO are already available for this type of integration. Nonetheless, even with this hybrid design, low-abundance proteins would remain difficult to capture accurately.

Applying Machine Learning to Generate a Real-Time Simulation
Current machine learning frameworks such as TensorFlow and PyTorch, along with algorithms like transformers and recurrent neural networks, are already well-suited to time-series prediction. Similar approaches have been applied to modalities such as scRNA-seq. For instance, Slingshot uses trajectory inference to order cells along pseudotime paths, RNA-velocity leverages spliced/unspliced RNA counts as an internal clock to predict future states, and MEFISTO integrates multiple omic layers (e.g. scRNA-seq with scATAC-seq) for multimodal prediction.
Nonetheless, applying ML to proteomics presents unique challenges: extreme sparsity (the ~6,000 proteins detectable with modified SCoPE2 still cover only a fraction of the proteome) and the difficulty of separating causation from correlation. A simplified pipeline for a real-time simulation is outlined in Fig. 6.
Sparsity is unlikely to be resolved without advances in instrument sensitivity. For now, simulations would be restricted to measured proteins, though unmeasured proteins might be inferred indirectly using known causal connections from the literature.
To address causation vs. correlation, Causal Representation Learning (CRL) could be employed instead of pure reinforcement learning. CRL incorporates additional knowledge (such as known pathways, stoichiometric relationships, and turnover equations) to better reflect underlying mechanisms. In this framework, variables such as translation rate, degradation rate, and PTM state can be disentangled, rather than treating protein abundance changes as simple correlations.
Before generating empirical data, model feasibility could be tested using a synthetic dataset. Simple turnover ODEs (protein synthesis and degradation with randomized rate constants) can produce semi-realistic proteome snapshots and time progressions. These synthetic trajectories, augmented with simulated dropout and ionisation bias to mimic SCoPE2 data, could be used to validate both the translational and dynamics models. Success criteria could then be benchmarked against predefined predictive targets.
Equipment
Mass Spec
UCD Conway Proteomics Core have an Orbitrap Exploris 480 suitable for SCoPE2, and a timsTOF Pro for top-down on the ~10% carrier [5]. The closest core with an Orbitrap Eclipse Astral is at the University of Birmingham (UK).
Raman Microscopy
UCD Spectral Imaging Research Group have a Renishaw inVia system [6].
Live-Seq
Live-Seq requires specialised FluidFM equipment and would need to be run alongside MS and Raman. Capital setup would be required on site at UCD.
Computational Resources
The Irish national HPC centre (ICHEC) offers GPU partitions free for SFI-funded projects; if SFI funding is secured, fees may be waived. Dedicated storage would be needed for Raman cubes.
Figure References
Figure 2
Figure 3
Figure 4
Figure 5
References
- Kettenbach AN, Rush J, Gerber SA. Absolute quantification of protein and post translational modification abundance with stable isotope-labeled synthetic peptides. Nat Protoc. 2011;6(2).
- Zimmer D, Schneider K, Sommer F, Schroda M, Mühlhaus T. Artificial intelligence understands peptide observability and assists with absolute protein quantification. Front Plant Sci. 2018;9.
- Kobayashi-Kirschvink KJ, Comiter CS, Gaddam S, et al. Prediction of single cell RNA expression profiles in live cells by Raman microscopy with Raman2RNA. Nat Biotechnol. 2024;42:1726–1734.
- Pavillon N, Smith NI. Non-invasive monitoring of T cell differentiation through Raman spectroscopy. Sci Rep. 2023;13:3129.
- UCD Conway Institute for Biomolecular and Biomedical Research. Proteomics Core – Mass Spectrometry Resource [Internet]. Available from: https://www.ucd.ie/conway/research/coretechnologies/proteomicscoremassspectrometryresource/
- UCD Spectral Imaging Research Group [Internet]. Available from: https://www.ucd.ie/sirg/research/lab/
- Sinha A, Mann M. A beginner's guide to mass spectrometry-based proteomics. The Biochemist. 2020;42.
- Murray K. Gas Chromatography Mass Spectrometry (GC/MS) [Internet]. Available from: https://www.pinterest.com/pin/388224430356485243/
- Thomas RJ. Guide to ICP-MS Part IX — Mass Analyzers: Collision / Reaction Cell Technology.
- Bruker Daltonics. timsTOF Pro and PASEF: Multiplying Sequencing Speed and Sensitivity in Proteomics [Internet]. 2018 Jun 29. Available from: https://www.youtube.com/watch?v=NScsqtDrtkA&ab_channel=BrukerDaltonics
- Kumar M. Mass Spectroscopy, Slide 51 [Internet]. 2021 Nov 16. Available from: https://www.slideshare.net/slideshow/mass-spectroscopy250662463/250662463#51
- Griffiths RL, et al. Comprehensive LESA Mass Spectrometry Imaging of Intact Proteins by Integration of Cylindrical FAIMS. Anal Chem. 2020;92(4).
- Creative Proteomics. Q Exactive Hybrid Quadrupole-Orbitrap Mass Spectrometer [Internet]. Available from: https://www.creative-proteomics.com/support/q-exactive-hybrid-quadrupole-orbitrap-mass-spectrometer.htm
- Shuken SR. An Introduction to Mass Spectrometry-Based Proteomics. J Proteome Res. 2023;22(7).
- Johnson PE, Baumgartner S, Aldick T, et al. Current perspectives and recommendations for the development of mass spectrometry methods for the determination of allergens in foods. J AOAC. 2011;94(4).
- Specht H, Emmott E, Petelski AA, et al. Single-cell proteomic and transcriptomic analysis of macrophage heterogeneity using SCoPE2. Genome Biol. 2021;22:50.
- Chen W, Guillaume-Gentil O, Rainer PY, et al. Live-seq enables temporal transcriptomic recording of single cells. Nature. 2022;608:733–740.
- Bounab Y, Eyer K, Dixneuf S, et al. Dynamic single-cell phenotyping of immune cells using the microfluidic platform DropMap. Nat Protoc. 2020;15:2920–2955.
- Bovenkamp D, Micko A, Püls J, et al. Line Scan Raman Microspectroscopy for Label-Free Diagnosis of Human Pituitary Biopsies. Molecules. 2019;24:3577.
Comments
Loading comments...